R Data Visualization
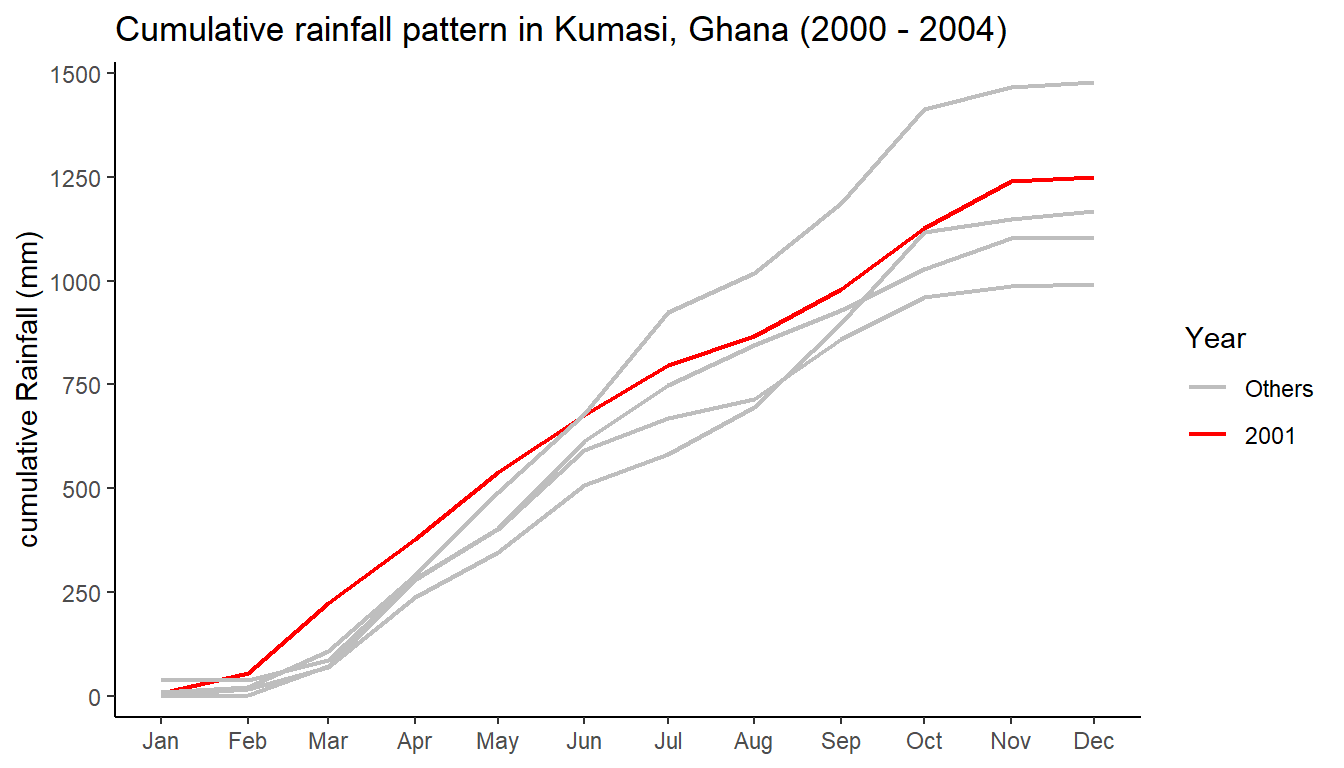
Rainfall pattern in Kumasi, Ghana
This post illustrates R's ability to draw a follow-up plot, isolating one period so it can be compared to the other.
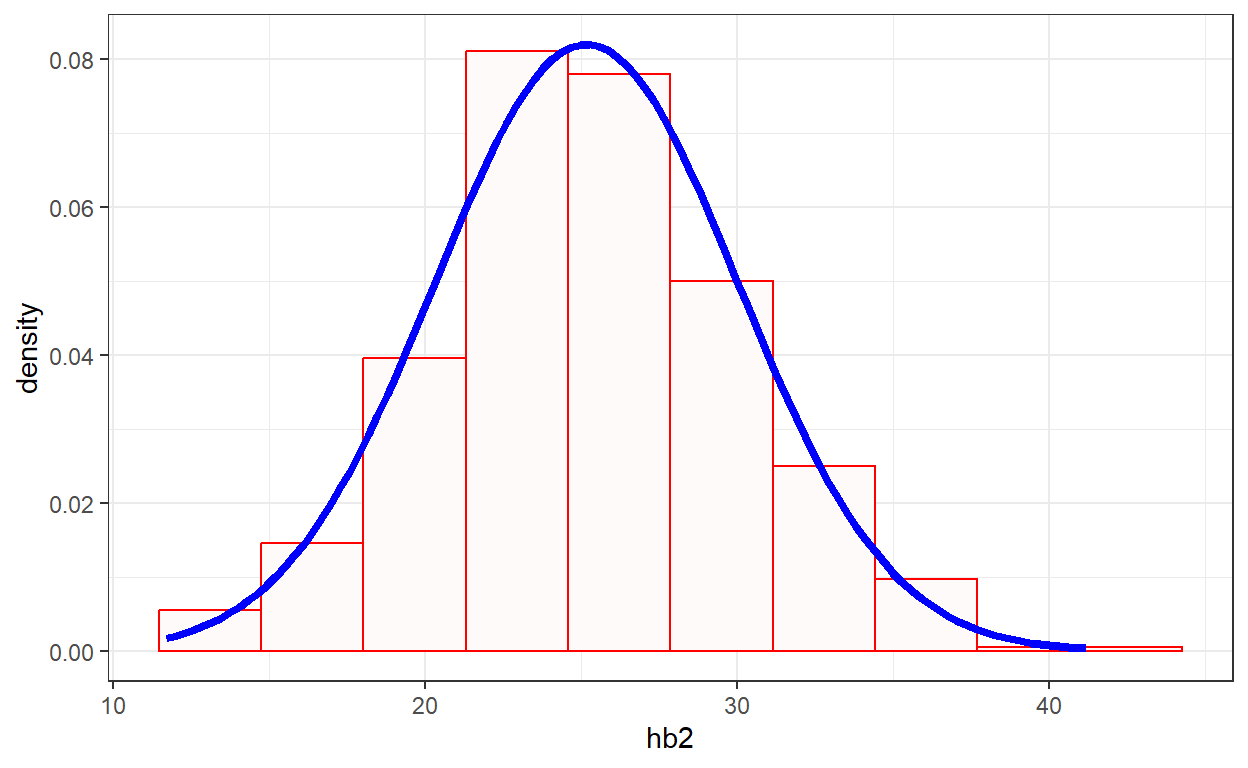
Histogram with normal curve
This is a short description of the codes needed to draw a histogram with the density distribution.
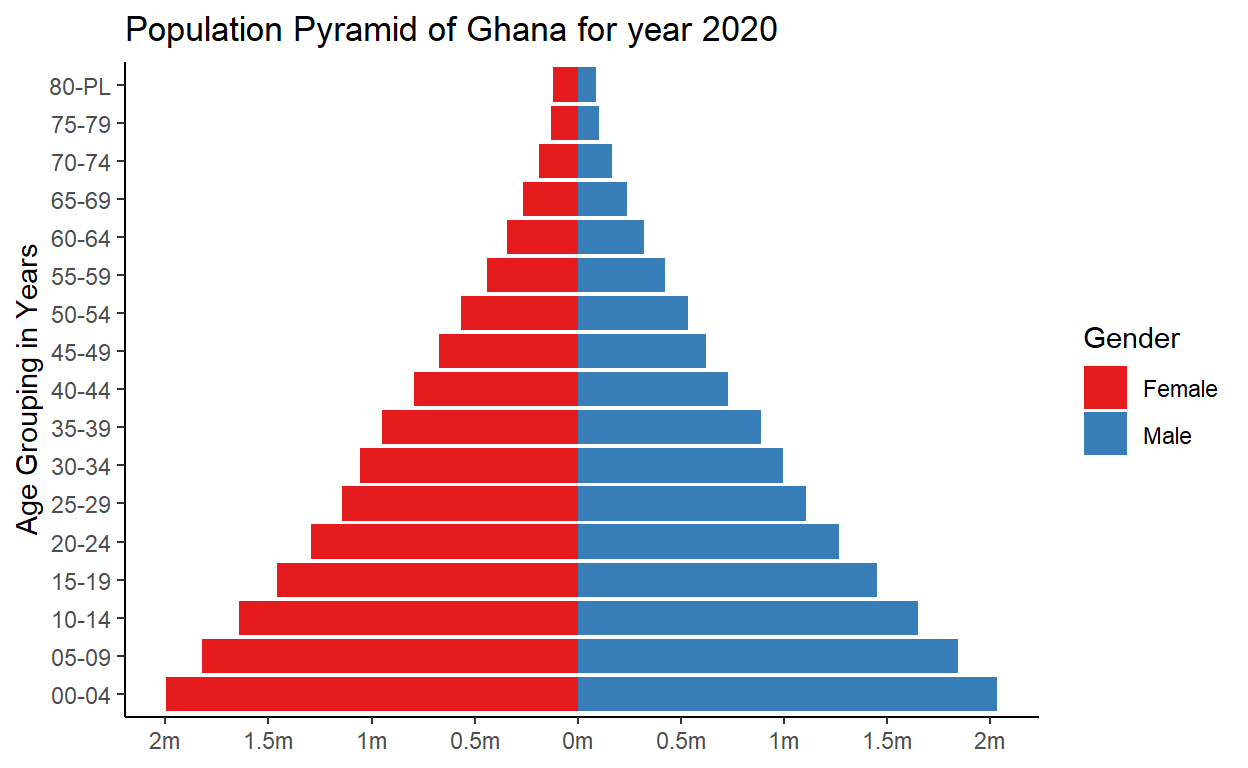
Ghana's Population Pyramid 2020
A population pyramid, age structure diagram or age-sex pyramid is an illustrative graph that shows the relationship between sex and age distribution of a specified population. The shape describes the population structure, often differentiating between developed and developing countries. This post illustrates R's ability to construct a population pyramid.