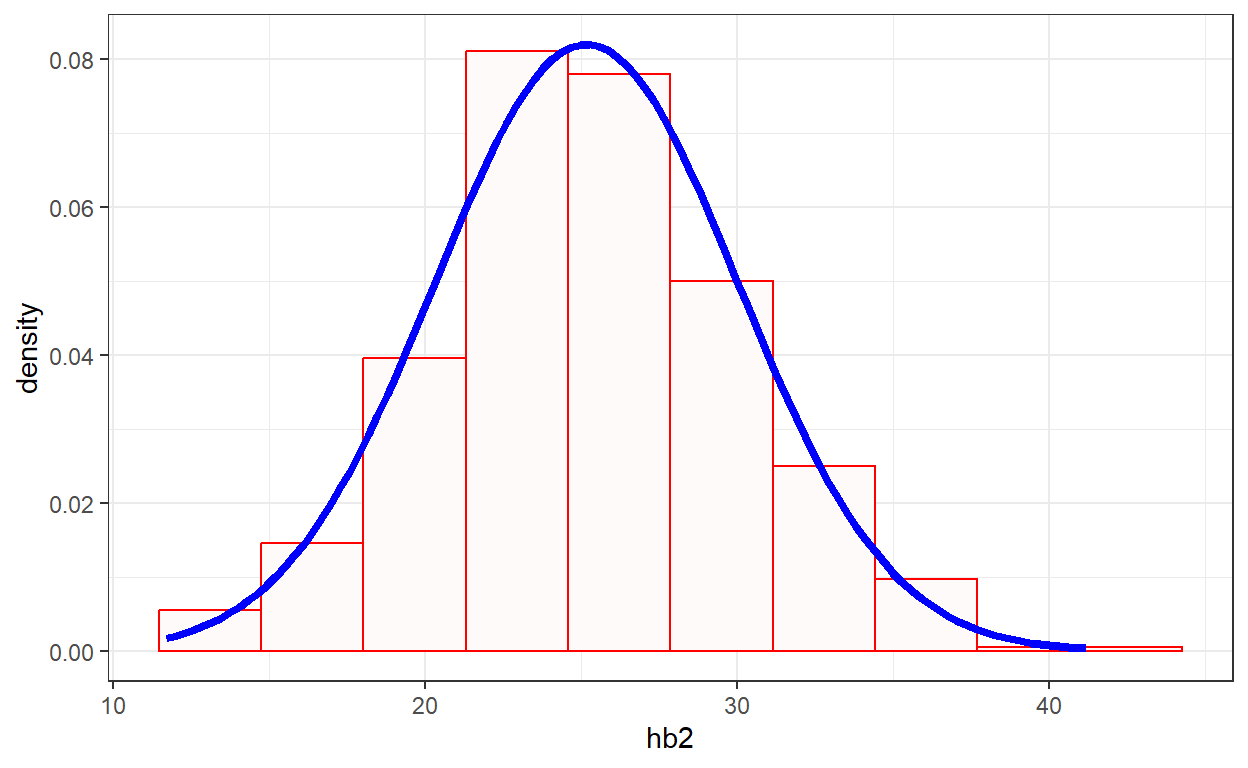
An example plotting of histogram with normal density curve
set.seed(123)

dataF <- data.frame(hb2 = rnorm(500, mean = 25, sd = 5))

dataF%>%
    ggplot(aes(x = hb2))+
    geom_histogram(
        aes(y = after_stat(density)), bins=10, fill = "snow", col = "red") +
    stat_function(
        fun = dnorm,
        args = list(mean = mean(dataF$hb2, na.rm=T),
                    sd = sd(dataF$hb2)), col = "blue",
                    linewidth = 1.5)+
    theme_bw()