We begin by importing the data and visualizing it
Data Frame Summary
df_sonos
Dimensions: 147 x 3
Duplicates: 80

-----------------------------------------------------------------------------------
No   Variable      Stats / Values         Freqs (% of Valid)   Valid      Missing
---- ------------- ---------------------- -------------------- ---------- ---------
1    side          1. Right               147 (100.0%)         147        0
     [character]                                               (100.0%)   (0.0%)

2    sono1         Mean (sd) : 1 (0.2)    14 distinct values   146        1
     [numeric]     min < med < max:                            (99.3%)    (0.7%)
                   0.5 < 1 < 1.9
                   IQR (CV) : 0.3 (0.2)

3    sono2         Mean (sd) : 1 (0.2)    11 distinct values   146        1
     [numeric]     min < med < max:                            (99.3%)    (0.7%)
                   0.5 < 1 < 1.5
                   IQR (CV) : 0.3 (0.2)
-----------------------------------------------------------------------------------
Intraclass Correlation Coefficient
This is a measure of how the two measures correlate with the various accepted categorizations: - Less than 0.40 — Poor. - Between 0.40 and 0.59 — Fair. - Between 0.60 and 0.74 — Good. - Between 0.75 and 1.00 — Excellent.
 Single Score Intraclass Correlation

   Model: twoway
   Type : agreement

   Subjects = 146
     Raters = 2
   ICC(A,1) = 0.49

 F-Test, H0: r0 = 0 ; H1: r0 > 0
 F(145,144) = 2.96 , p = 1.08e-10

 95%-Confidence Interval for ICC Population Values:
  0.357 < ICC < 0.603
ICC is rather low.
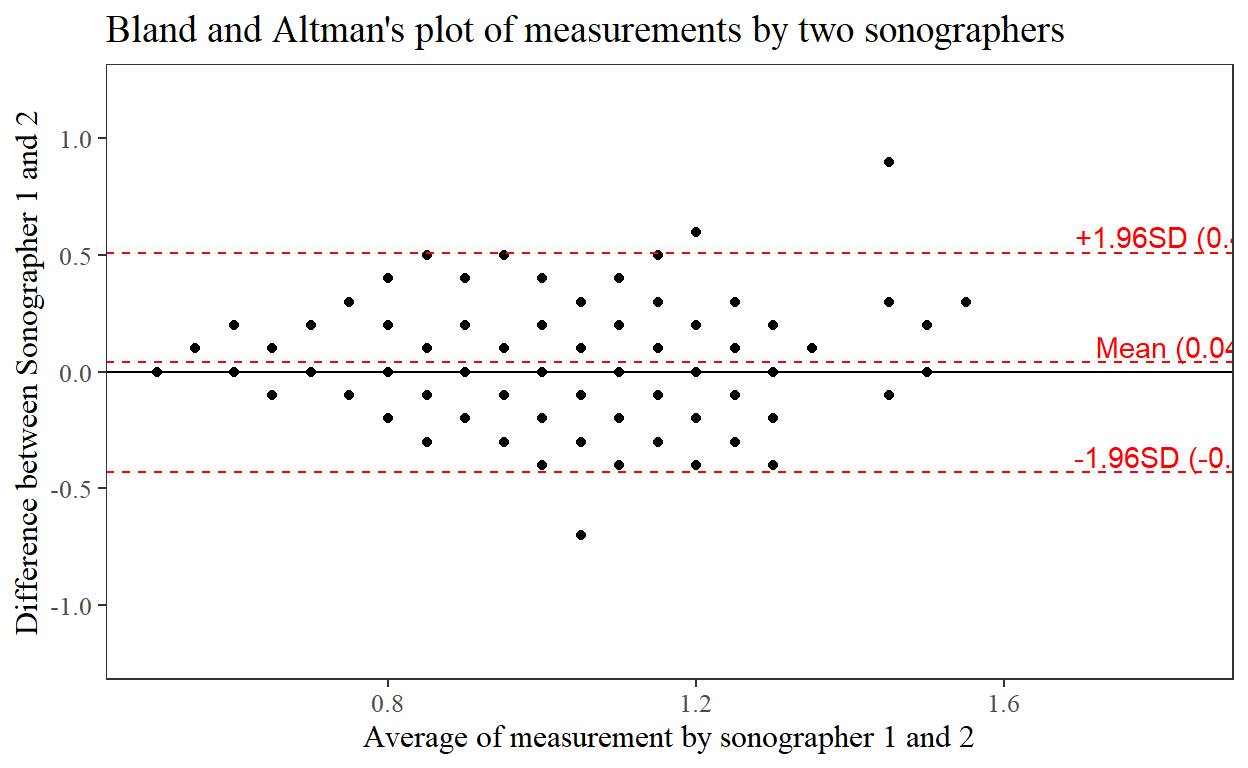
Bland-And_Altman’s plot
Next we draw a Bland-And-Altmans plot